Accurate, low-overhead per process bandwidth monitoring on Linux in 40 lines of bpftrace
- Existing tools to measure bandwidth usage on Linux
- Measuring bandwidth with
bpftrace - The full program
- Adding live updates
- Future work
- Further reading
Existing tools to measure bandwidth usage on Linux
Searching for “per process network usage linux” is disappointing. Most of the recommended tools – like iftop, nload, bmon, and iptraf – miss the mark by quite a bit: they mostly report per-interface or per-socket traffic, leaving to the user the tedious exercise of mapping sockets to processes via perilous parsing of /proc/net/tcp, or grep-ping and awk-ing of the output of ss or netstat. Not only this is very laborious and fragile, but it also risks missing spikes of traffic on very short-lived sockets.
A tool that gets mentioned a lot is nethogs. Differently from the previous tools, nethogs does report per-process bandwidth usage, but it suffers from other flaws.
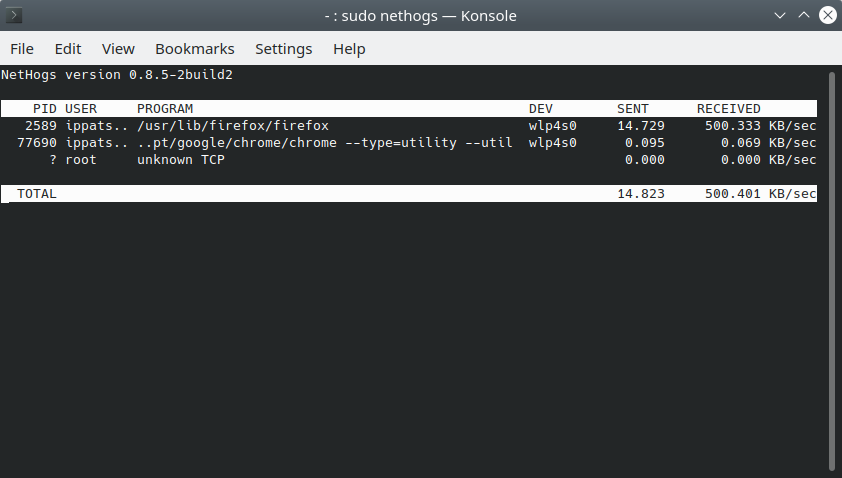 Screenshot of nethogs.
nethogs works by parsing /proc/net/tcp and /proc/net/tcp6 to get a mapping from connected TCP endpoints to inodes, capturing all traffic using libpcap, parsing each packet, and finding which process owns the TCP connection of each packet. This approach comes with two disadvantages:
- it requires a costly copy from kernel space to user space for every single packet;
- it is blind to all non-TCP traffic (see issues/62
We can easily build accurate monitoring for all traffic in only 40 lines of code for bpftrace.
Measuring bandwidth with bpftrace
bpftrace is tracing tool for Linux that allows defining tracing programs that get entirely executed within the kernel. It translates a high-level domain specific language used to define probes into enhanced Berkeley Packet Filter (eBPF, or just BPF)1 code that allows accurate measurements with minimal overhead2. Refer to this guide to install bpftrace on your system. bpftrace’s language is inspired by awk and C, and some predecessor tracing systems like DTrace and SystemTap.
There are excellent online resources to learn how to write bpftrace programs, see the Further reading section. In the following I’m going to explain line-by-line how to write a bpftrace program that measures per-process network traffic.
The full program
This is socktraf.bt, a bpftrace program for accurate per-process measurement of network traffic:
#!/usr/bin/bpftrace
#include <net/sock.h>

BEGIN
{
  printf("Tracing per-PID, per-thread network traffic. Ctrl-C to stop\n");
}

kprobe:sock_recvmsg,
kprobe:sock_sendmsg
{
  $sock = (struct socket *)arg0;
  $family = $sock->sk->__sk_common.skc_family;
  if ($family == AF_INET || $family == AF_INET6) {
    @inetsocket[tid] = 1;
  } else {
    @inetsocket[tid] = 0;
  }
}

kretprobe:sock_recvmsg
{
  if (@inetsocket[tid] && retval < 0x7fffffff) {
    @recv_bytes[pid, comm] = sum(retval);
  }
  delete(@inetsocket[tid])
}

kretprobe:sock_sendmsg
{
  if (@inetsocket[tid] && retval < 0x7fffffff) {
    @send_bytes[pid, comm] = sum(retval);
  }
  delete(@inetsocket[tid])
}

END
{
  clear(@inetsocket);
}
When executed, it prints something like this:
$ sudo bpftrace socktraf.bt
Attaching 6 probes...
Tracing per-PID, per-thread network traffic. Ctrl-C to stop
^C

@recv_bytes[1566, geoclue]: 578
@recv_bytes[1713, DNS Res~ver #19]: 874
@recv_bytes[1713, DNS Res~ver #17]: 936
@recv_bytes[905, NetworkManager]: 1376
@recv_bytes[1713, DNS Res~ver #14]: 1592
@recv_bytes[45389, ThreadPoolForeg]: 2804
@recv_bytes[1566, pool-geoclue]: 3711
@recv_bytes[900, avahi-daemon]: 9262
@recv_bytes[45354, Chrome_IOThread]: 11322
@recv_bytes[868, systemd-resolve]: 15892
@recv_bytes[1713, Socket Thread]: 47374097
@recv_bytes[45389, Chrome_ChildIOT]: 136530022

@send_bytes[1566, geoclue]: 324
@send_bytes[1713, DNS Res~ver #19]: 470
@send_bytes[1713, DNS Res~ver #17]: 554
@send_bytes[1713, DNS Res~ver #14]: 604
@send_bytes[45354, Chrome_IOThread]: 688
@send_bytes[1566, pool-geoclue]: 759
@send_bytes[45389, ThreadPoolForeg]: 1582
@send_bytes[868, systemd-resolve]: 8754
@send_bytes[1713, Socket Thread]: 136655
@send_bytes[45389, Chrome_ChildIOT]: 847803
The total number of bytes is computed by directly tapping into the kernel’s sock_recvmsg and sock_sendmsg functions.
@recv_bytes is a map from (PID, task name) to the number of bytes read by that task. @send_bytes is a map from (PID, task name) to bytes written by that task. This explains why some PIDs are repeated: socktraf.bt groups traffic by PID and kernel-level thread name. In the output above, for example, I had Firefox running with PID 1713, and we can see that DNS resolution is delegated to different threads.
This simple bpftrace program has several advantages compared to tools like nethogs and iptraf:
- it gets data directly from the kernel without any polling, so it doesn’t miss a single byte,
- it does not require any costly data copy from kernel space to user space,
- the machine code generated by the program is safely executed in kernel space with little overhead.
Let’s analyze this program line by line.
Preamble
The preamble of the program is:
#!/usr/bin/bpftrace
#include <net/sock.h>

BEGIN
{
  printf("Tracing per-PID, per-thread network traffic. Ctrl-C to stop\n");
}
The first line – #!/usr/bin/bpftrace – is a shebang. This tells the kernel that socktraf.bt should be interpreted by /usr/bin/bpftrace.
The second line – #include <net/sock.h> – allows us to access kernel-level structure defined in net/sock.h. This will come in handy once we install our probes for sock_recvmgs and sock_sendmsg.
Finally, the BEGIN stanza prints a welcome message and explains how to terminate the script. bpftrace’s printf instruction is currently limited to 64 characters.
Installing kprobes
kprobe:sock_recvmsg,
kprobe:sock_sendmsg
{
  $sock = (struct socket *)arg0;
  $family = $sock->sk->__sk_common.skc_family;
  if ($family == AF_INET || $family == AF_INET6) {
    @inetsocket[tid] = 1;
  } else {
    @inetsocket[tid] = 0;
  }
}
This stanza install a dynamic probe on the entry point of Linux functions sock_recvmsg and sock_sendmsg. Dynamic probes attached in this way to kernel functions are called kprobes, refer to bpftrace documentation for more details about the supported probes.
Note that functions have one entry point, but can have multiple return points. We install return probes, called kretprobes in the stanza described in the next section.
The syntax to install a probe in bpftrace is simply a comma separated list of probes:
kprobe:sock_recvmsg,
kprobe:sock_sendmsg
{
  // Install a probe on sock_recvmsg and sock_sendmsg
  // ...
}
Now that we installed a probe, our program will be notified whenever a process is sending or receiving data. We now need to verify that the socket is an AF_INET or AF_INET6 data, that is an IPv4 or IPv6 socket, because we are interested in network-only traffic and these functions are used for all sockets, including e.g. Unix sockets.
When using kprobes arg0, arg1, …, argN are the arguments of the function being instrumented. The first argument of both sock_recvmsg and sock_sendmsg is a struct socket*.
$sock = (struct socket *)arg0; takes arg0, casts it to struct socket * and stores the result in a variable called $sock. In bpftrace variable name that start with $ are “scratch variables” and are local to a stanza.
Checking Linux source code we can see that a lot of the internal state of a socket is represented by sk field, which is a struct sock*, which contains, among the other things, the socket family.
We can access the fields of $sock using the -> and . operators, similarly to what we would do in C and C++. So to retrieve the family of the socket we write $family = $sock->sk->__sk_common.skc_family;.
The number of bytes read/written is the return value of sock_recvmsg/sock_sendmsg, which is available only in the kretprobe, we therefore need a global variable that tells a kretprobe whether it should count the amount of bytes or not. Global variables are instantiated by declaring them using @, in this example we declare @inetsocket.
We also need to match the kprobe with its kretprobe. To do so, we make @inetsocket an associative array by indexing it by tid, which is done simply by using square brakets: @inetsocket[tid]. tid is builtin bpftrace variable containing the thread id (aka kernel pid) of the process being executed.3. We will write a 1 in @inetsocket[tid] if the socket is an internet socket, and 0 otherwise:
  if ($family == AF_INET || $family == AF_INET6) {
    @inetsocket[tid] = 1;
  } else {
    @inetsocket[tid] = 0;
  }
Measuring incoming data
kretprobe:sock_recvmsg
{
  if (@inetsocket[tid] && retval < 0x7fffffff) {
    @recv_bytes[pid, comm] = sum(retval);
  }
  delete(@inetsocket[tid])
}
This code installs a kretprobe, that is code executed when kernel code is returning. kretprobes have access to a bpftrace builtin variable called retval, which contains the return value of the traced function.
In this code we first check that @inetsocket[tid] is true value, that is if we are returning from a sock_recvmsg call operating on an internet socket. We then check if retval is positive4, because sock_recvmgs returns a negative value in case of failure. If these two conditions are true, then we need to account for retval worth of received bytes. We do this by introducing a new global associative array called @recv_bytes. @recv_bytes is indexed by pid and comm, which are both bpftrace builtin variables. pid returns the userspace pid, a.k.a. tgid3, and comm contains the task name. We use the function sum to add the value of retval to the current value stored in @recv_bytes[pid, comm].
Finally, we remove the tid entry from @inetsocket with delete(@inetsocket[tid]). This is a common idiom that allows building thread-local variables.
Measuring outgoing data
kretprobe:sock_sendmsg
{
  if (@inetsocket[tid] && retval < 0x7fffffff) {
    @send_bytes[pid, comm] = sum(retval);
  }
  delete(@inetsocket[tid])
}
This code is identical to the previous one, the only difference is that we’re storing the output in @send_bytes.
Cleanup
END
{
  clear(@inetsocket);
}
When bpftrace terminates, it prints the content of its global variables. @inetsocket is not interesting, so we clear it in the END stanza, thus avoiding printing it to stdout.
That’s it. Accurate network monitoring in 40 lines of bpftrace.
Adding live updates
Adding live updates is straighforward costs 8 more lines:
interval:s:1
{
  time()
  print(@recv_bytes);
  print(@send_bytes);
  clear(@recv_bytes);
  clear(@send_bytes);
}
Quite intuitively, this code prints every second the current time, followed by the content of @recv_bytes and @send_bytes, which then get cleared.
Future work
bpftrace output is simple, but not very user friendly. Adding a ncurses interface, or a plugin for wtfutil or powerline is left as an exercise for the reader ;)
Further reading
bpftraceReference GuidebpftraceOne-liner Tutorial- Brendan Gregg: BPF Performance Tools, ISBN-13: 9780136554820
- BPF Performance Tools Github Repository
Berkley Packet Filter (BPF) was originally designed for processing of network packets only on BSD sysytems. In 2014 Alexei Starovoitov and Daniel Borkmann included an extended version of BPF – eBPF – in the Linux kernel. Despite its name eBPF its not limited to processing network packets only anymore: it can effectively tap and probe most of the kernel and user space function. ↩︎
BPF code is verified and compiled to native machine code by a JIT compiler. The verifier guarantees that BPF code can not cause leaks or privilege escalations. See this presentation by Netronome for more details. ↩︎
When viewed from the kernel each thread has a thread ID, called – confusingly – pid. Each thread also has a thread group id or tgid, which is the pid of the thread that started the whole process.
tgidis the identifier that is colloquially referred as pid in userspace. bpftrace’stidvariable contains the kernel pid, which is not the same as tgid. In user space you can find all tgids in/proc, and all the kernel pids in/proc/$PID/task/. ↩︎ ↩︎20x7fffffffis the largest 32 bit integer represented in two’s complement. An alternative approach would be to execute(int32)retval > 0. ↩︎